We compare four stimuli: the original input, blurred foveated rendering (Blur FR), blurred dichoptic rendering (Blur Dichoptic), and dynamically sharpened dichoptic rendering (Sharpen Dichoptic). All stimuli are rendered with 40 degrees field-of-view. The key difference is that dichoptic foveated rendering blurs the fovea and presents different foveation operations to the two eyes depending on eccentricity.
Mouse hover controls the region of image being shown using each technique. Select different scenes using the buttons:
All Main Study Stimuli
Here, we show stimuli used in the main study.
Validation Stimuli
Here, we show the stimuli used in the validation study.
Experiments
Experiment Video for Main Study
In our main psychophysical experiment, natural stimuli are shown to participants with differential blur and sharpening applied to the left and right eyes.
These stimuli are placed at different positions across the visual field; participants were asked to select one of two test stimuli that looked closer to an
unmodified reference content. Left and right stimuli below are shown to the left and right eyes, respectively. In this screencapture, we can see the participant
cycling between the reference and the two tests before making a decision.
Experiment Video for Validation Study
We validated whether our computational model could be applied to improve foveated rendering. In this study, we showed users 360 degree videos with foveated rendering
applied, with our dichoptic foveation techniques, and the unmodified video. Users rated video quality on a 5-point Likert scale. Participants were able to view stimuli
freely, with natural head and eye movements. Left and right videos represent the respective content shown to each eye.
Experiment Example Videos for Validation Study
Here, we show additional scenes with the different studied techniques in the validation study. Click the buttons to see different configurations. Here, we show
examples with no head or eye movement to clearly show distortion types.
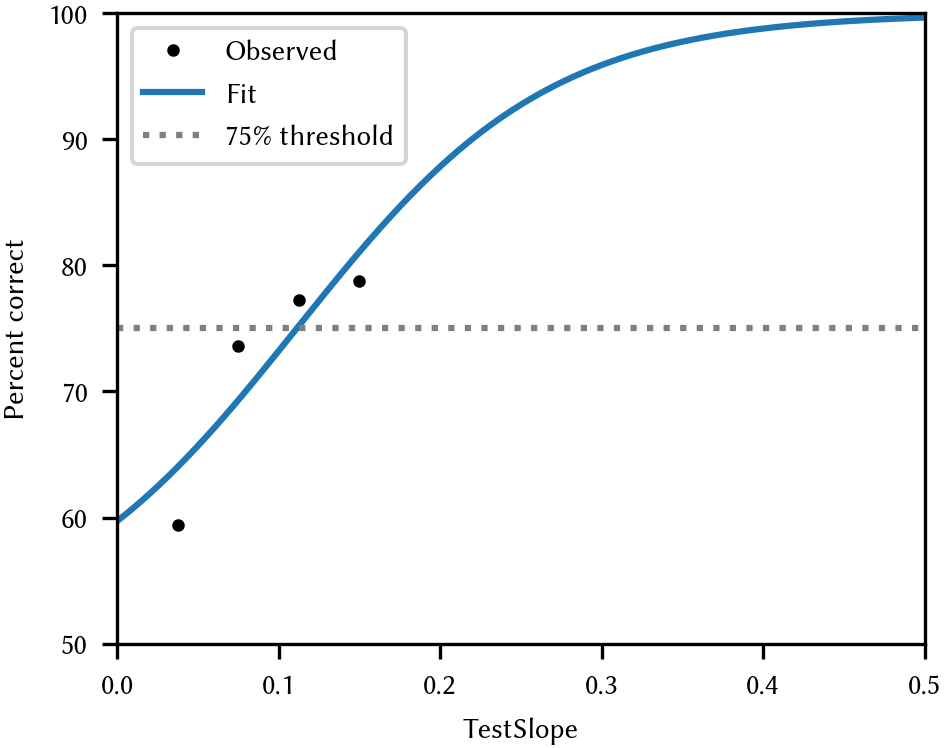
Foveated Rendering Calibration Results
Here, we show the fitted psychometric function to data from the foveated rendering calibration study (Sec. 5.2), aggregated across participants.
Tables
Model Comparison Results
Fitting results of different models to the data of our perceptual experiment on dichoptic stimuli (image patches). Lower AIC, BIC, and cross-validated RMSE indicate better model performance.
Model family
p
R²
Adj. R²
RSS
AIC
CV RMSE
Linear
3
0.6464
0.6314
2.4088
-32.93
0.1904
Linear + Interaction
6
0.7318
0.7081
1.8272
-44.41
0.1720
Exponential
6
0.7397
0.7167
1.7733
-46.66
0.1784
Quadratic
9
0.8321
0.8088
1.1440
-70.15
0.1464
Subject-level Mean Opinion Score (MOS) pairwise comparison statistics
Render types are: Dichoptic Rendering with Dynamic Sharpen (DS),
Dichoptic Rendering with Constant Sharpen (CS),
Foveated Rendering (FR), and Reference (Ref).
Reported are t-statistics, raw p-values, Bonferroni-corrected p-values,
and significance after Bonferroni correction.
Render Type
Render Type 2
tstat
praw
pbonf
significancebonf
DS
CS
1.839208
0.088829
0.532973
False
DS
FR
-2.658300
0.019698
0.118189
False
DS
Ref.
-3.060540
0.009113
0.054680
False
CS
FR
-3.856197
0.001984
0.011905
True
CS
Ref.
-3.711442
0.002612
0.015675
True
FR
Ref.
-1.588449
0.136200
0.817198
False
Subject-level Mean Opinion Score (MOS) pairwise comparison statistics for the ablation study.
Conditions include the Reference (Ref),
left-eye blurred (L), and right-eye blurred (R) renderings.
Reported are t-statistics, raw p-values, Bonferroni-corrected p-values,
and significance after Bonferroni correction.
Render Type
Render Type 2
tstat
praw
pbonf
significancebonf
Ref.
L
2.909116
0.019616
0.058847
False
Ref.
R
3.170444
0.013186
0.039558
True
L
R
1.778627
0.113187
0.339562
False
Theoretical Computational Savings
Theoretical savings from reduced sample density of dichoptic foveated rendering relative to standard foveated rendering.
Computations assume a linear relationship between sample density and compute cost, centered vision, and consider only the binocular overlap region.